Tổng số lượt xem trang
Thứ Tư, 18 tháng 4, 2018
SUBCUTANEOUS FAT MEASUREMENT by US
Abstract—A recently standardized ultrasound technique for measuring subcutaneous adipose tissue (SAT) was applied to normal-weight, overweight and obese persons. Eight measurement sites were used: upper abdomen, lower abdomen, erector spinae, distal triceps, brachioradialis, lateral thigh, front thigh and medial calf. Fat compression was avoided. Fat patterning in 38 participants (body mass index: 18.6–40.3 kgm22 ; SAT thickness sums from eight sites: 12–245 mm) was evaluated using a software specifically designed for semi-automatic multiple thickness measurements in SAT (sound speed: 1450 m/s) that also quantifies embedded fibrous structures. With respect to ultrasound intra-observer results, the correlation coefficient r 5 0.999 (p < 0.01), standard error of the estimate 5 1.1 mm and 95% of measurements were within ±2.2 mm. For the normal-weight subgroup, the median measurement deviation was 0.43 mm (1.1% of mean thickness), and for the obese/overweight subgroup it was 0.89 mm (0.5%). The eight sites used here are suggested to represent inter-individual differences in SAT patterning. High measurement accuracy and reliability can be obtained in all groups, from lean to overweight and obese, provided that measurers are trained appropriately.
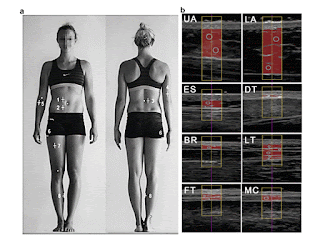
Fig. 1. B-Mode ultrasound measurement of uncompressed subcutaneous fat. (a) Sites for ultrasound measurement of subcutaneous adipose tissue (SAT) patterning: upper abdomen (1, UA), lower abdomen (2, LA), erector spinae (3, ES), distal triceps (4, DT), brachioradialis (5, BR), lateral thigh (6, LT), front thigh (7, FT) and medial calf (8, MC). Body height was used as the reference length for all distances. A detailed description of the standardized marking and of the ultrasound measurement technique can be found in M€uller et al. (2016). (b) Ultrasound images and evaluations of SAT thicknesses. Participant A: male, body mass index 5 25.5, body mass 5 80.7 kg, stature 5 1.78 m. (c) Survey plot of SAT patterning according to (b). The columns represent the mean values of the semi-automatic multiple thickness measurements for the eight ultrasound sites. The mean thickness value of the SAT thickness in a given ultrasound image (within the region of interest) is termed dINCL (gray) when fibrous structures are included and dEXCL (black) when fibrous structures are subtracted. Sum of the eight thicknesses DINCL 5 44.3 mm (DEXCL 5 39.8 mm). (d) Survey plot of a participant B with similar body mass index. Body mass index 5 25.4 kgm22 ; body mass 5 75.5 kg, stature 5 1.72 m. The SAT thickness sum was 86.9 mm (77.9 mm), 96% higher than in participant A.
(E-mail: wolfram.mueller@medunigraz.at) 2016 The Authors. Published by Elsevier Inc. on behalf of World Federation for Ultrasound in Medicine & Biology. This is an open access article under the CC BY-NC-ND license (http://creativecommons.org/licenses/by-nc-nd/4.0/).
Key Words: Body composition, Subcutaneous adipose tissue, Overweight, Obesity, Ultrasound measurement precision.
Đăng ký:
Đăng Nhận xét
(
Atom
)


Không có nhận xét nào :
Đăng nhận xét